Natural Resource BiometricsX-Y Scatter GraphsA scatter graph is a fundamental type of graph that allows you to plot one variable on the x axis against another variable on the y axis. You should use this type of graph in Excel to compare two variables. The axis should be labeled with the variable names and units if available. 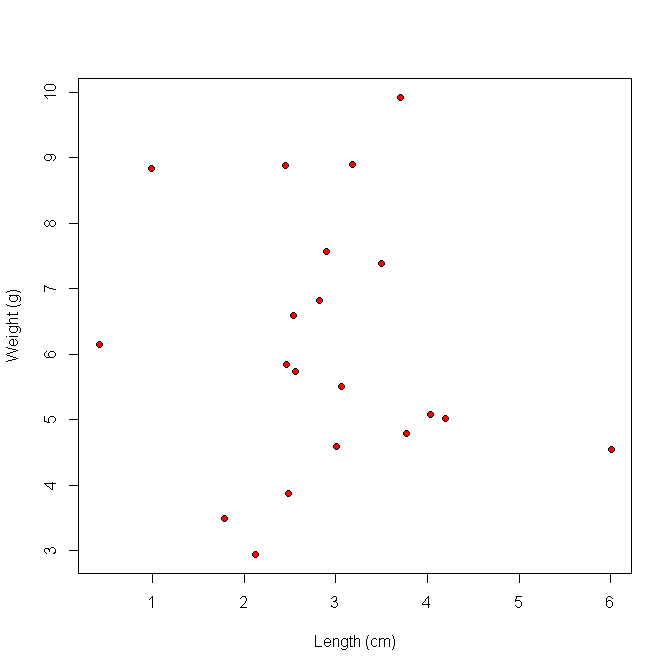
Figure 1. An Example scatter graph.
|
 Natural Resources Biometrics by David R. Larsen is licensed under a Creative Commons Attribution-ShareAlike 4.0 International License. Author: Dr. David R. Larsen Created: October 6, 2013 Last Updated: December 12, 2019 |